Summarizing the Research
 I have to admit, while we were out each day it is difficult to get a sense of the "bigger picture" concerning all the data involved. It is sometimes a little boring looking for, say, caterpillars. You just have to walk around turning over leaves until you see something, then when you do, you have to write it on the data sheet.
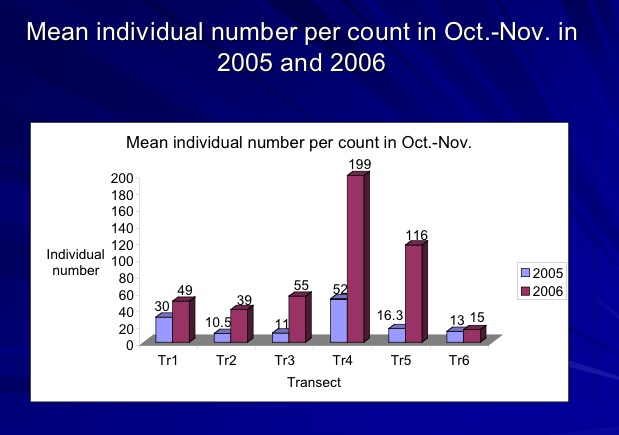
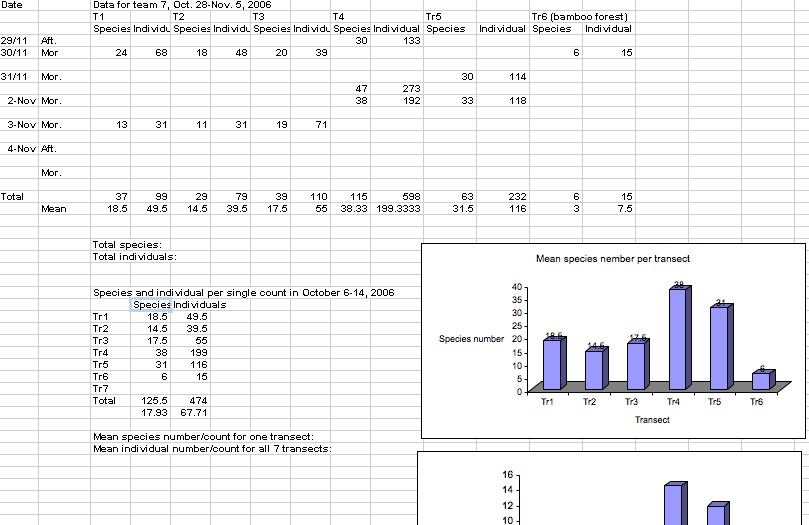 But now that all our information has been compiled it looks impressive and it means something. According to the data collected from this session, compared to previous ones, you can see that the number of overall species observed is higher as compared to this time last year.
These numbers reflect total individuals (not species) sighted in each transect. This chart demonstrates how the numbers are compiled in a spreadsheet.
posted by Bonnie at 8:02 AM
![]()


0 Comments:
Post a Comment
<< Home